This article covers creating a Dashboard in {{ glossary.R365}}-intelligence-overview-security">R365 Intelligence, an R365 add-on feature.
In R365 Intelligence, users can create customized Dashboards. Intelligence dashboards are interactive displays that users can create to view and explore their business data. Users can create multiple dashboards as needed by their organization. Intelligence dashboards update as data is collected, and this allows users to more efficiently access data related to their organization.
About Dashboards
Dashboards are collections of data within R365 Intelligence. In addition to the R365 Dashboard Masters, which are the dashboards pre-built by R365, users can also create their own personal dashboards. Once dashboards are created, users can add visualizations, or visual representations of the selected data. Visualizations can be customized to include necessary information and datasets in the way that best showcases the data. They allow for users to view and interpret data more efficiently.
Within a single dashboard, users can create chapters and pages. Visualizations can be sorted into different pages, which can then be sorted and organized into chapters. Users can sort and organize their data as needed in ways that make most logical sense for their organization. R365 Intelligence allows for the creation of multiple dashboards.
Users can do the following in the build of their dashboard pages:
Import data from files and databases, then add that data to a visualization within the dashboard
Create and include new attributes, metrics, and groups of attribute elements using existing Intelligence objects
Add additional objects including text, images, and other web content
Drag and drop attributes, metrics to change displayed data, create filters, and group data
Once dashboards have been created and designed, they can be edited as needed. To learn more about editing Dashboards, click here.
Video - How To Create a Customized Dashboard
Navigation
Dashboards are created and accessed from the R365 Intelligence home screen, the Dashboards page.
Navigation Steps
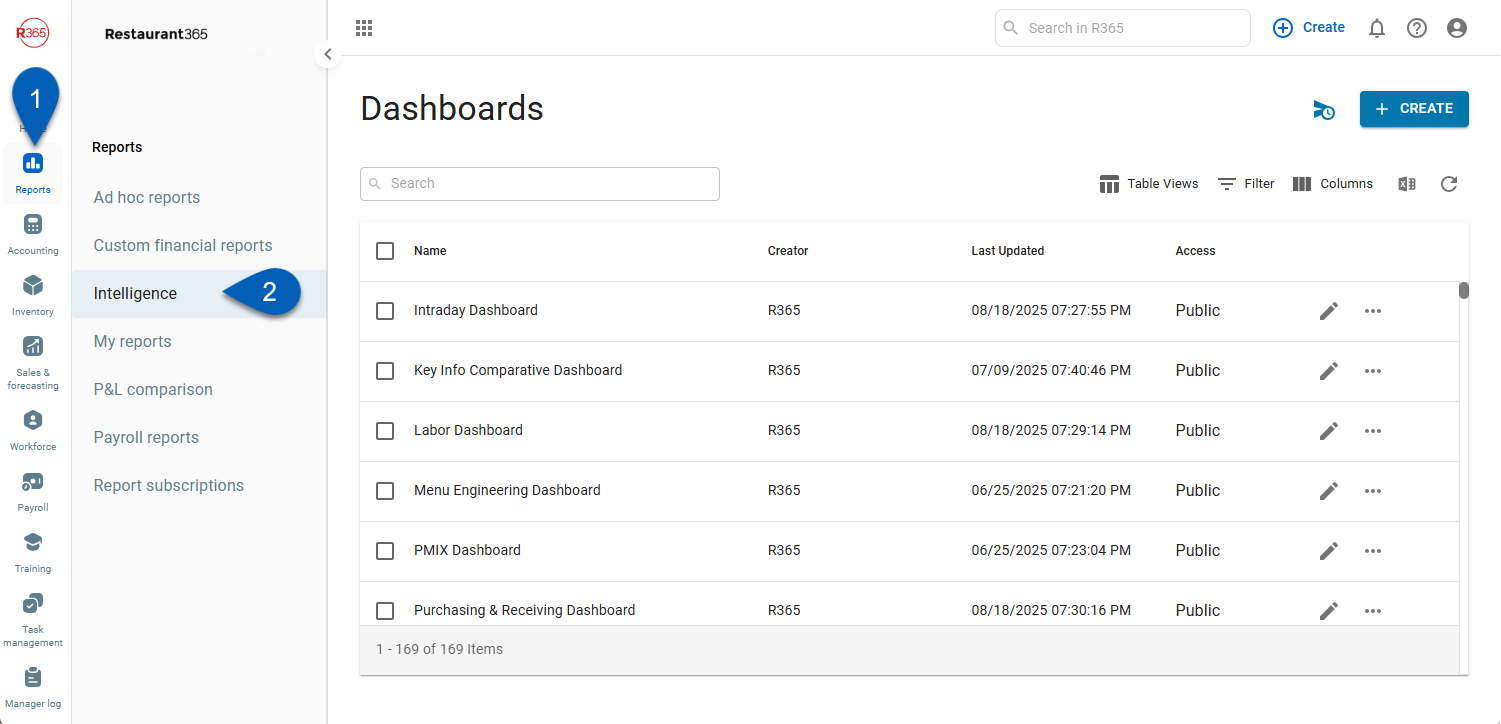
Open the Reports app.
Click Intelligence.
Search
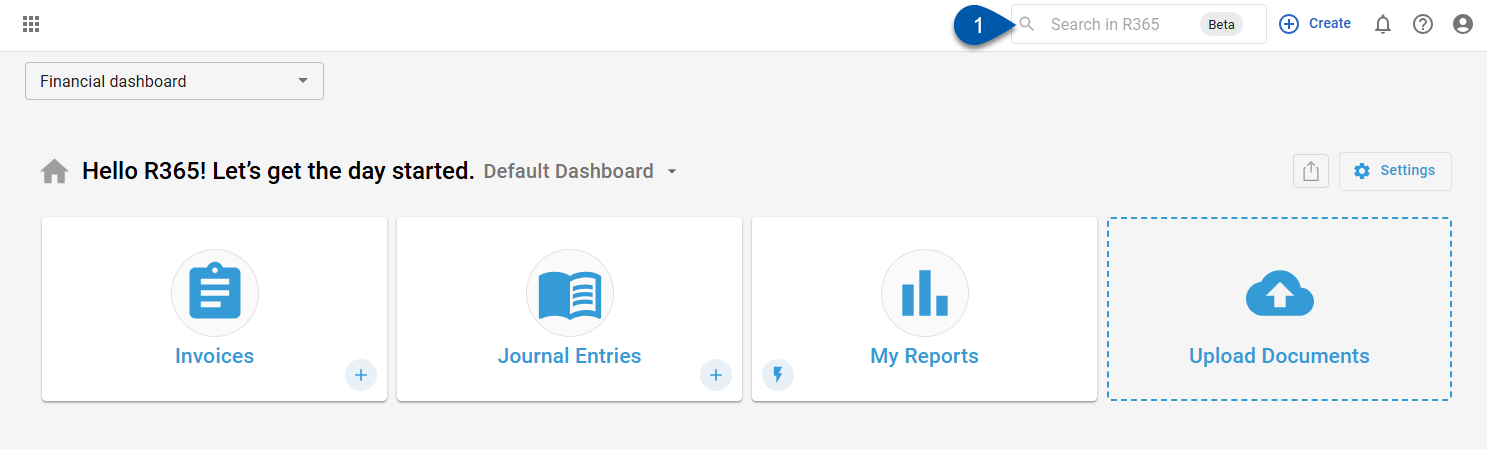
Navigate to pages with the R365 global search bar:
Enter all or part of the page name in the R365 global search bar.
Select the page from the results list.
Only enabled pages can be searched for. If the desired page is not enabled, contact your CSM for assistance.
Create a New Dashboard
To create a new dashboard, follow these steps:
Click steps to expand for additional information and images.
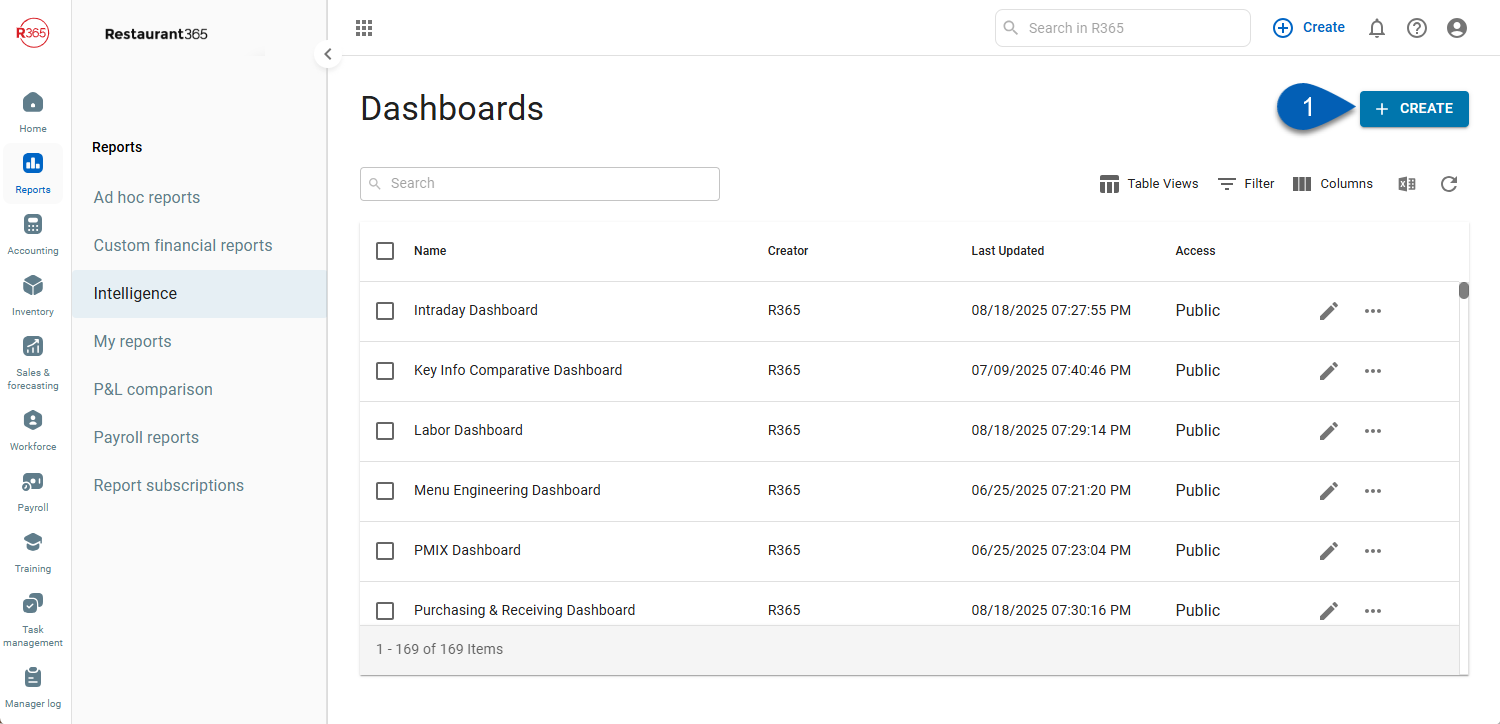
1) On the Dashboards page, click the Create button.
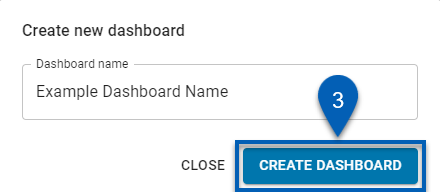
2) Name the dashboard. This can be edited later.
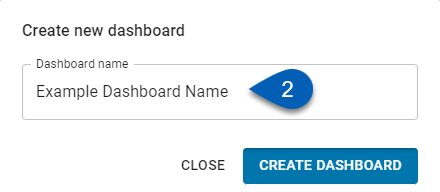
3) Click Create Dashboard.
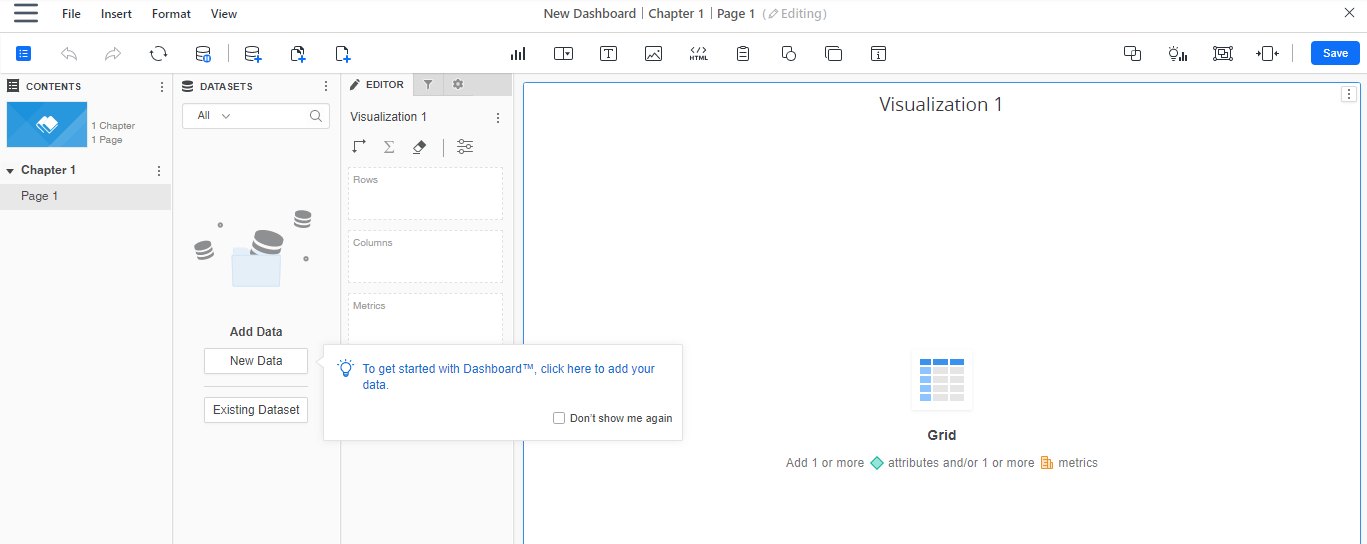
4) A new, blank dashboard will open in edit mode for users to begin customizing.
Building a Dashboard
Dashboards are built by creating Visualizations with selected data. To begin building a dashboard, follow these steps:
Click steps to expand for additional information and images.
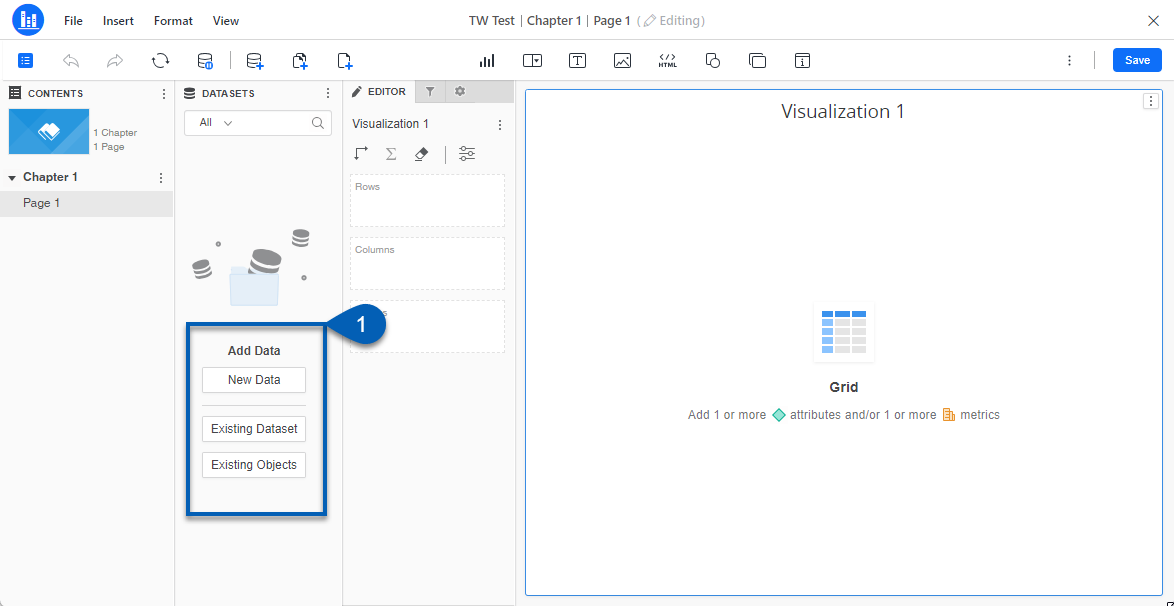
1) Add attributes and metrics to the datasets panel.
Add data using one of the following methods:
2) Once a method for adding data is completed, the attributes and metrics will be added to the datasets panel.
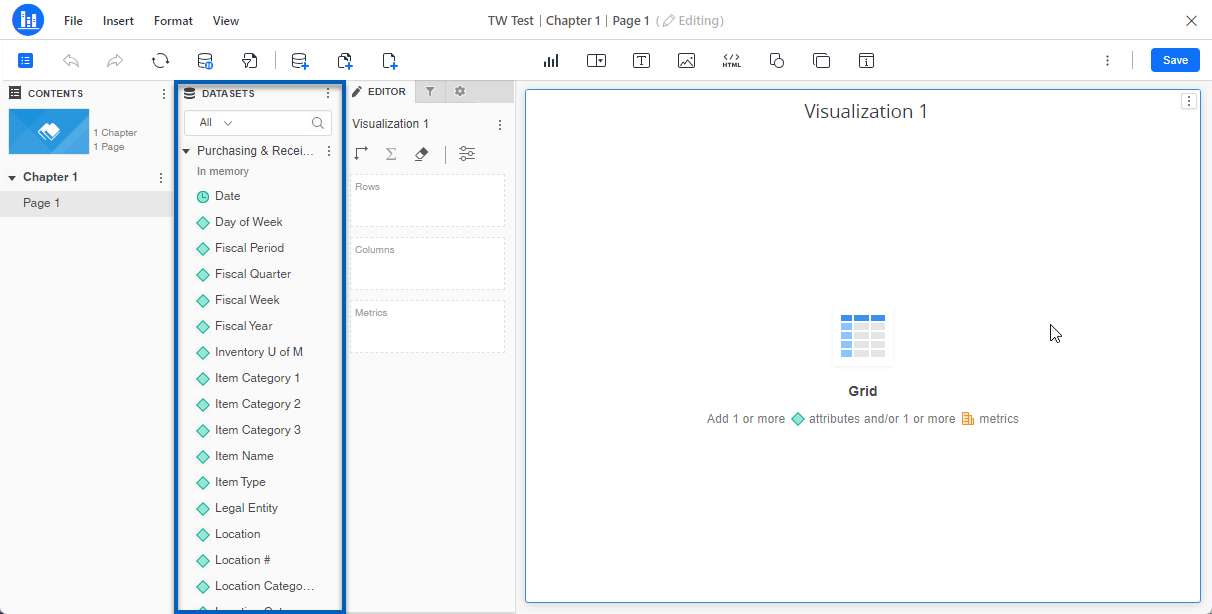
3) To begin building a visualization, add data objects by double-clicking the object or dragging and dropping the data object to the editor panel.
Visualizations will update with the data as attributes and metrics are added or removed.
Data labeled with teal/blue colored icons
 are called attributes and are fixed variables (dates, day of week, fiscal year, operational quarter, locations, etc.)
Data labeled with orange/yellow colored icons
 are called metrics and are calculated metrics that will calculate across the data that is grouped (gross sales, guest count, forecasted sales, SPLH, labor hours etc.)
If necessary, create new attributes and metrics within dashboard edit mode. To read more about creating data, click one of the following:
4) Once all necessary data has been added to a Visualization, edit the visualization as necessary.
Visualizations can be edited from the editor or within the visualization. Learn more about customizing visualizations.
5) After the first visualization is created, proceed with designing the dashboard by adding and editing additional objects or visualizations by clicking the appropriate icons from the top of the dashboard editor.
6) Click the Save button  continuously to save any changes made to the dash
Users will be notified that the dashboard has been saved successfully.
R365 Best Practices
For faster data loading and ease when creating dashboards, R365 suggests the following:
Add Chapter-Level Date Filters
Adding date filters at the chapter-level is recommended to narrow the scope of the data. Without date parameters, reports will run for all the available dates, which can go back up to 3 years. Adding a date filter will allow the data to run only within the selected parameters, which will result in faster load times.Pause Data Retrieval When Editing Dashboards
Data is continuously updated in R365. Pausing data retrieval momentarily stops data updates, which can allow visualizations to load quicker as they are built or edited. Data retrieval can can be paused and resumed by clicking the pause/resume data retrieval buttonfrom the left edit header.