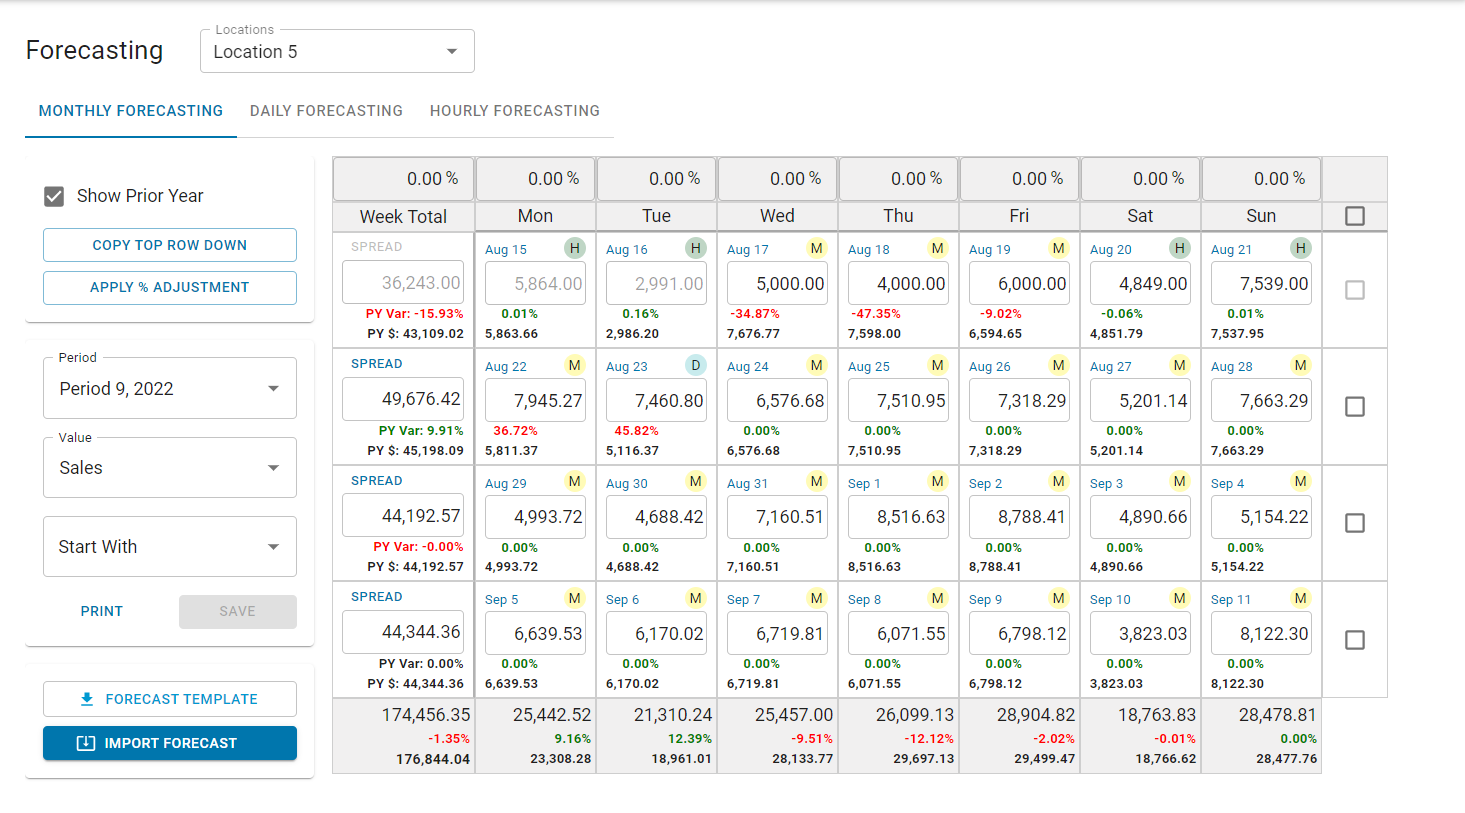
Monthly Forecasting enables Users to set a Sales Forecast by Location by Period by entering in daily values, spreading a Weekly Total value evenly across all days, importing daily amounts, or even clicking into any date listed to update its Daily Forecast. This forecasting feature is designed to work for Organizations that have their Operational Year setup as 13-4 week periods, 4/4/5 periods, 4/5/4 periods, or 5/4/4 periods so that it can be based on weeks.
Create a Forecast
In creating a new forecast, ensure that the desired Location is selected in the header. The Monthly Forecast will auto-populate the Smart Forecast based on the Current Period and Sales. These values can be overwritten, if desired, by updating their fields.
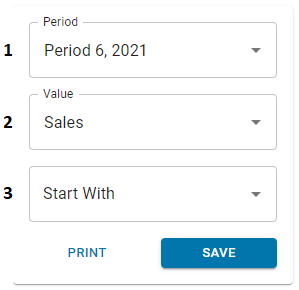
1) Period - The period that will be forecasted
2) Value - This is currently only available for a Sales Forecast
3) Start With - This will populate the values in the forecast based on the selection made. This selection only impacts the current date and future days. Options include:
Smart Forecast (20XX - 2 Years Ago) - The system starts by getting the daily trend percentage between this year and the year before last, which is done by pulling the average Sales by weekday for the past 8 weeks and then comparing that to the average Sales by weekday for those same 8 weeks two years ago. This percentage will either increase or decrease the actual values from the year before last for this same period to provide your Smart Forecast
Smart Forecast (20XX - Current Year) - This will pull the average Sales by weekday for the past 8 weeks. All days with $0 Sales and the days with the highest and lowest Sales will be excluded from this average
Smart Forecast YoY - The system starts by getting the daily trend percentage between this year and the previous year, which is done by pulling the average Sales by weekday for the past 8 weeks and then comparing that to the average Sales by weekday for those same 8 weeks the prior year. This percentage will then either increase or decrease the actual values from the previous year for this same period to provide your Smart Forecast
Prior Yr Actual - This will populate the forecast with the actual values from the same period last year
Prior Yr Forecast - This will populate the forecast with the forecast values from the same period last year
Prior Period Forecast - This will populate the forecast with the forecast from the previous period
Prior Period Actual - This will populate the forecast with the actual values from the previous period
Set All to 0 - This will set all values in the forecast to $0
'Start With' options that look to past years will be disabled if historical data for the comparison year is not present for the period selected.
The forecasting grid will populate with the selections made. Additionally, data from the previous year can be added to the grid to show a comparison in Sales.
The values that appear in the grid can then be manually updated by entering in unique values, adjusting the current values, or copying values to other rows in the grid.
Days before the current date will be locked and read-only.
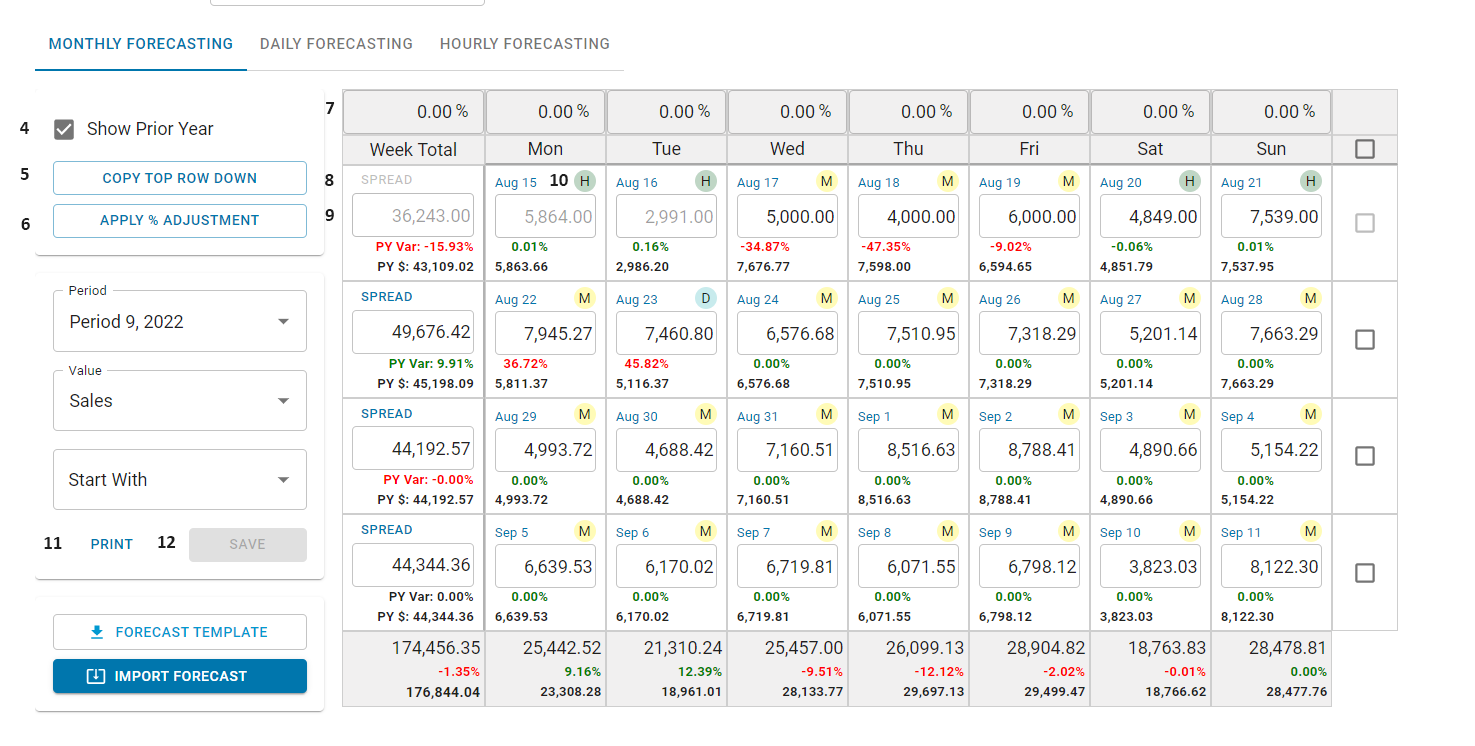
4) Show Prior Year - When checked, this will display two additional values in each box: the Prior Year Actual Value (PY $) and the Variance between the Prior Year Actual and the forecast value (PY Var)
The PY Var may be either of the following colors:
Red - The variance between the prior year and current year is greater than 5%
Green - The variance between the prior year and current year is less than 5%
5) Copy Top Row Down - This will copy the first row values for each day of the week down to the other rows. If one or more days are completed for a given week, this functionality will be disabled for that week
6) Apply % Adjustment - This will increase the values in the forecast by the percentage entered in the percentage increase row (#7). This will only update the rows that have been selected
7) Percentage Increase - The percentage amount that the values in each selected row will be adjusted by once the Apply % Adjustment button (#6) is clicked
Entering in a percentage in the Week Total column will update all daily percentages to this amount
8) Spread - This button will spread the amount entered in the Week Total column evenly across all days. However, if a day has passed for a given week, this button will be disabled for that week
9) Daily / Weekly Forecast - This field is the forecasted Sales for that specific day while the first column will display the entire Weekly forecast. Each of these fields can be manually updated as needed and either copied to other rows (#5) or spread over an entire week (#8)

The bottom row of the grid displays the total forecasted Sales for individual weekdays within the period below its corresponding weekday and the total forecasted Sales for the entire period in the first column.
10) Forecast Type - Indicates the Forecasting tab used to publish the Forecast for that day
 - Indicates that the Forecast was published from the Monthly Forecasting tab
 - Indicates that the Forecast was published from the Daily Forecasting tab
 - Indicates that the Forecast was published from the Hourly Forecasting tab
 - Indicates that the Forecast was Imported
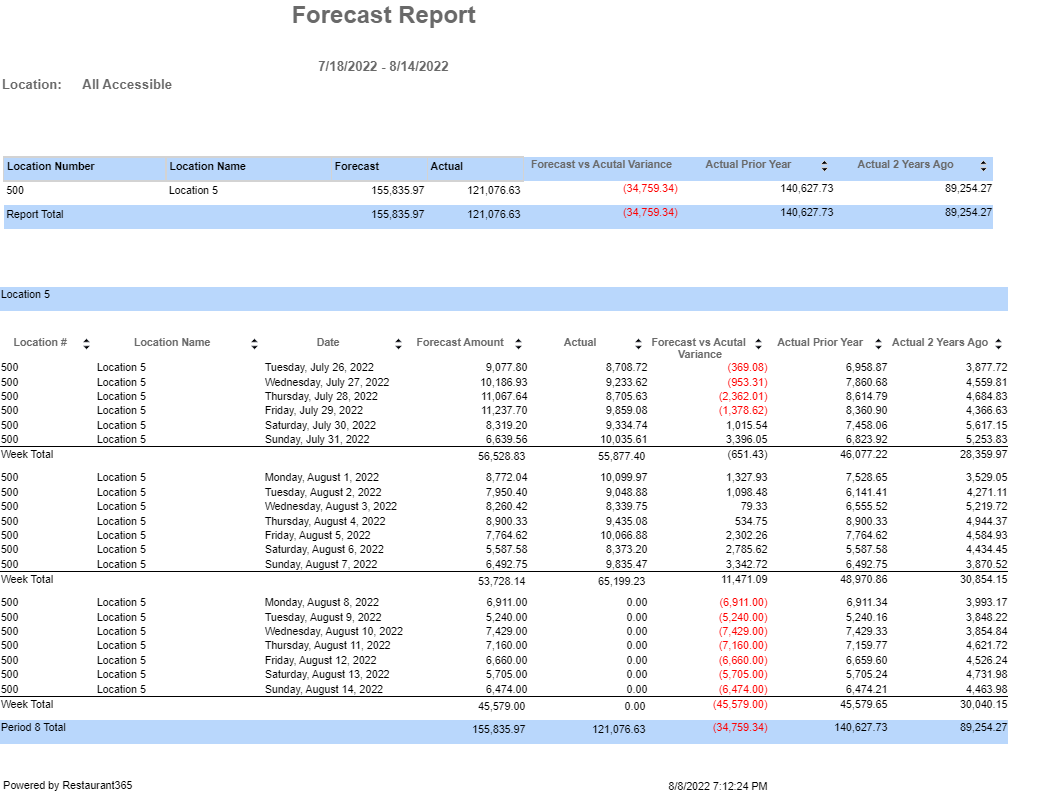
11) Print - The Forecast Report can be viewed, downloaded, and printed as needed by clicking the 'Print' button.
The Print button will only be displayed for Users who have the Forecast Report included in their Report Roles
12) Save - When the Forecast is complete, click 'Save' to save the Forecast before closing the window.

Click here to navigate to the Daily Forecast training article.
Importing a Forecast
Forecasts can be uploaded in bulk. With this method, the amounts entered for each day will be imported without adjustment. Once uploaded, additional adjustments can be applied in the same fashion as creating a Forecast above.
Users with the following Permission will be able to Import Forecasts:
Sales & Cash → Forecasts → Monthly Forecasts → Import Monthly Forecasts
Forecast Template
Click  to download a blank Forecast template in CSV format.
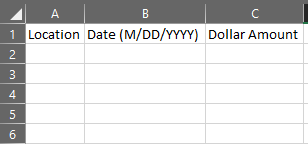
The Forecast template has three required columns:
Location- Location Name or Location Number
Note: Multiple Locations can be imported on the same Forecast template as long as the User importing the template has access to all of the Locations being imported.
Important Note: Location Name or Location Number must match exactly to the Location list. Any differences will cause that row of the import to fail.
Date (M/DD/YYYY)- Date that the Dollar Amount will be applied to
Important Note: The format for dates must be MM/DD/YYYY. Other date formats will cause that row of the import to fail.
Dollar Amount - Forecast amount for the Location and date
Importing the Forecast Template
After the Forecast template is filled out with the appropriate Forecast information, the template can be imported.
Click  to open the Import window
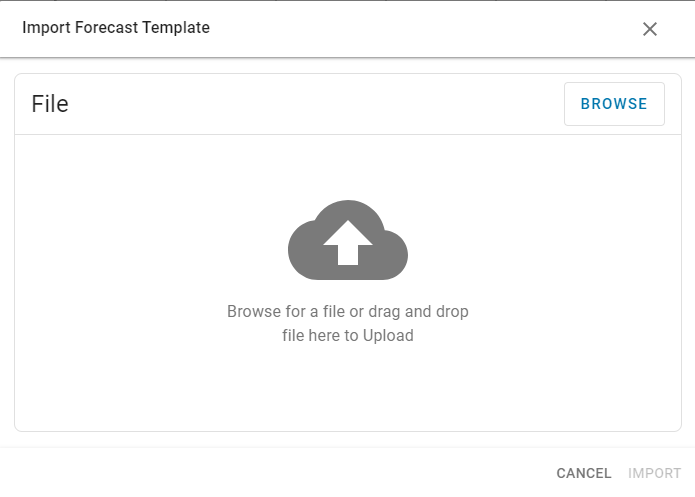
Select the desired file by dragging and dropping or browsing, then click to import the file, or
 to close without importing.
Only one Forecast template can be imported at a time
An import summary will appear displaying the number of successfully imported records and any records with errors.
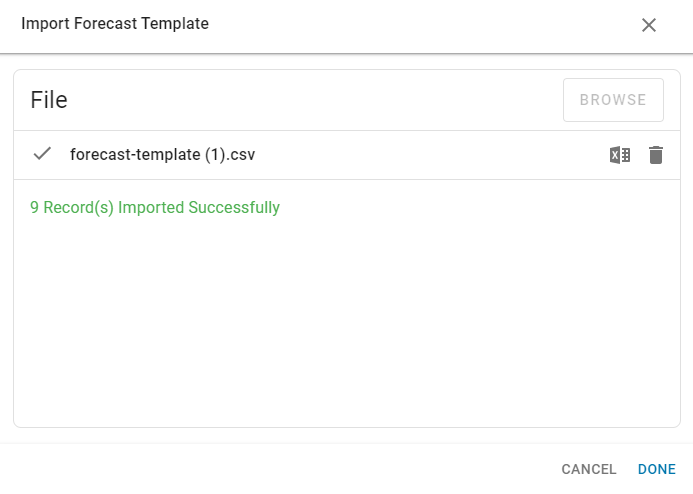
Click 'Cancel', 'Done', or 'X' to close the import window.
Import Errors
Correction List
If any records within the import failed, the import summary will include the quantity of failed records and the reason for their failure, as well as an option to 'Download Correction List'
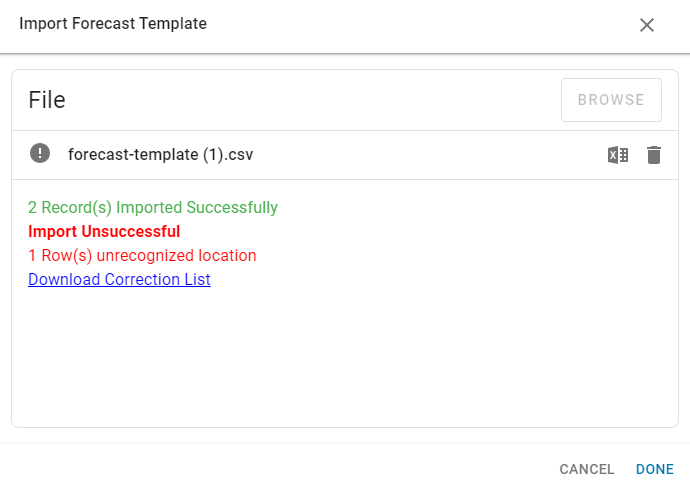
Download the Correction List, then click 'Cancel', 'Done', or 'X' to close the import window.
The Correction List will contain only the rows that need to be corrected and an explanation of the problem

Correct any issues in the Correction List, then click  to open the Import window and import the corrections.
Import Error List
The following errors will cause rows to fail when Importing a Forecast:
Unrecognized date - The date is in the incorrect format or not complete. Dates must be in MM/DD/YYYY format.
Unrecognized location - Location Number or Location Name does not match the Location list
Date in the past - The business date (based on Location time zone) has already passed
Duplicate - Same date and Location combination exist in more than one row
Missing Operational Calendar - No Operational Calendar has been saved for this date
Location Access: User does not have access to the Location
Publishing Conflicts
If the Forecast for the day was published from the Hourly Forecasting tab, a warning will be displayed when publishing any changes:
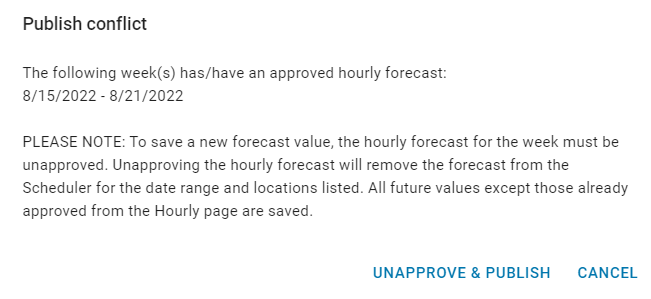
Clicking 'Unapprove & Publish' will unapprove the Hourly Forecast and republish the new Forecast for the day. Since the Hourly Forecast is unapproved, the Labor Forecast will not be displayed on the Scheduling Calendar. For the Labor Forecast to appear on the Scheduling Calendar, the Hourly Forecast will need to be deleted and re-generated.
Any day that has been changed and republished from the Daily Forecasting or Monthly Forecasting tabs will have a variance when viewed on the Hourly Forecasting tab.
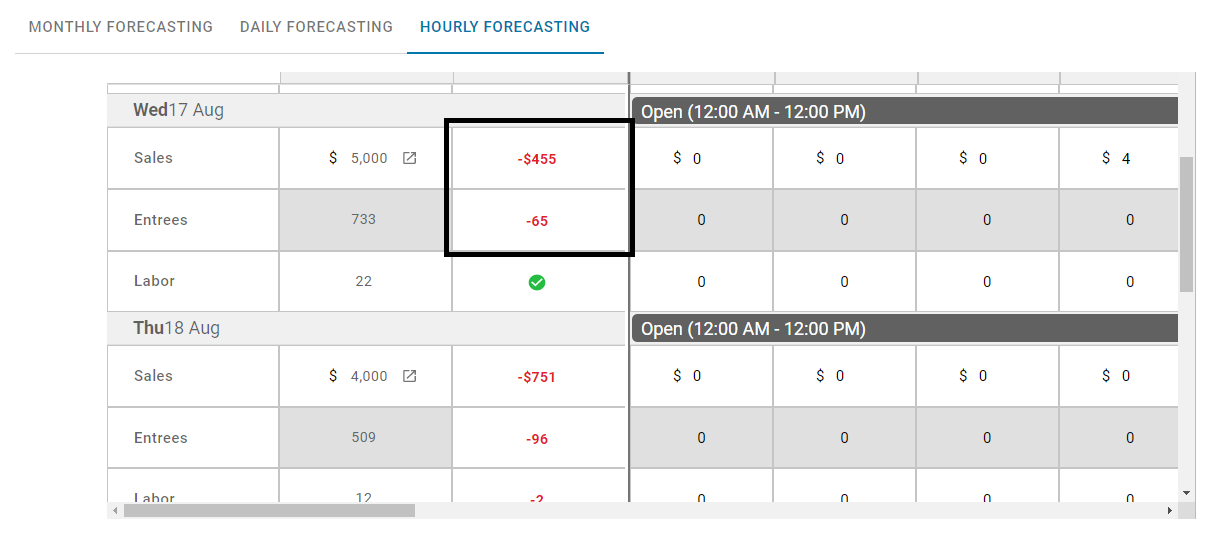
Follow these steps to clear and re-generate the Hourly Forecast:
Navigate to to the Hourly Forecasting tab
Delete the current Hourly Forecast

Click the 'Generate' button to re-generate the Hourly Forecast with the new Daily Forecasted value

Approve
