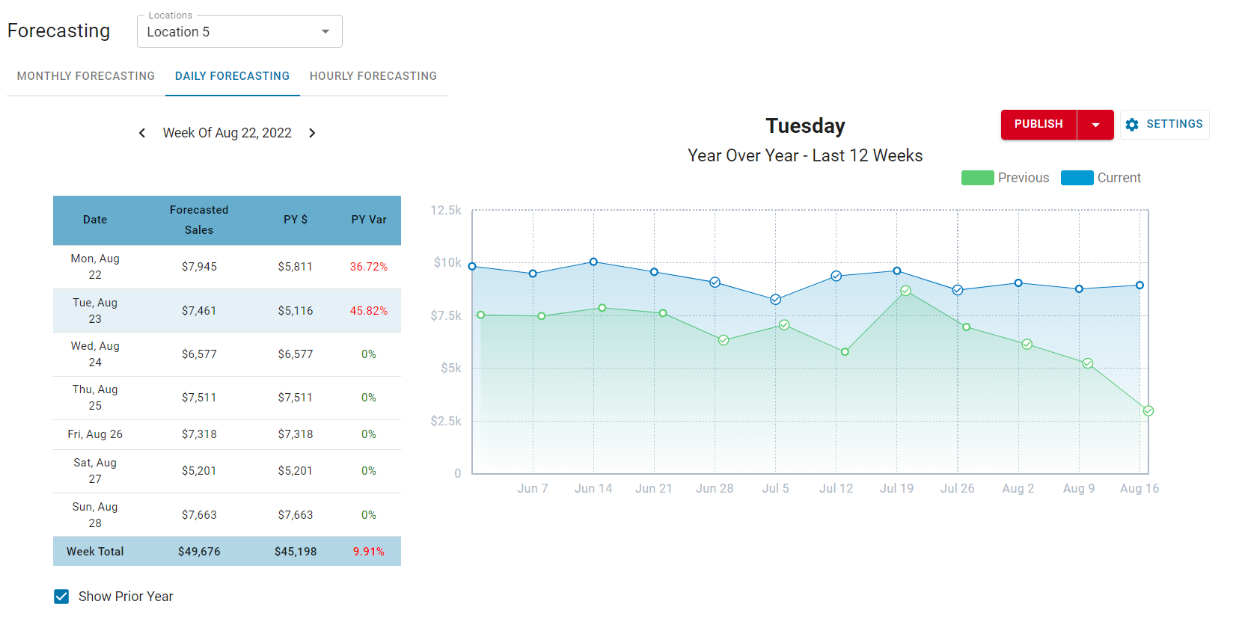
The Daily Forecast allows for a more customizable forecast that can drive predictive behavior throughout the software and plan ahead more strategically. The date a User selects for the Sales Forecast will display the Sales data from the past 12 weeks against the same 12 weeks from the previous year. The Forecasted Sales Amount, however, will be based on the past 8 weeks from the current year and the same 8 weeks from the previous year so as to provide a more accurate look into Sales for the upcoming week.
If one day's Sales stands far above a normal day due to certain circumstances (poor weather, holiday, large event, etc.), it can be tagged for that specific day and even removed from the graph to provide more precise data for the Forecasted Sales.
Daily Forecasting
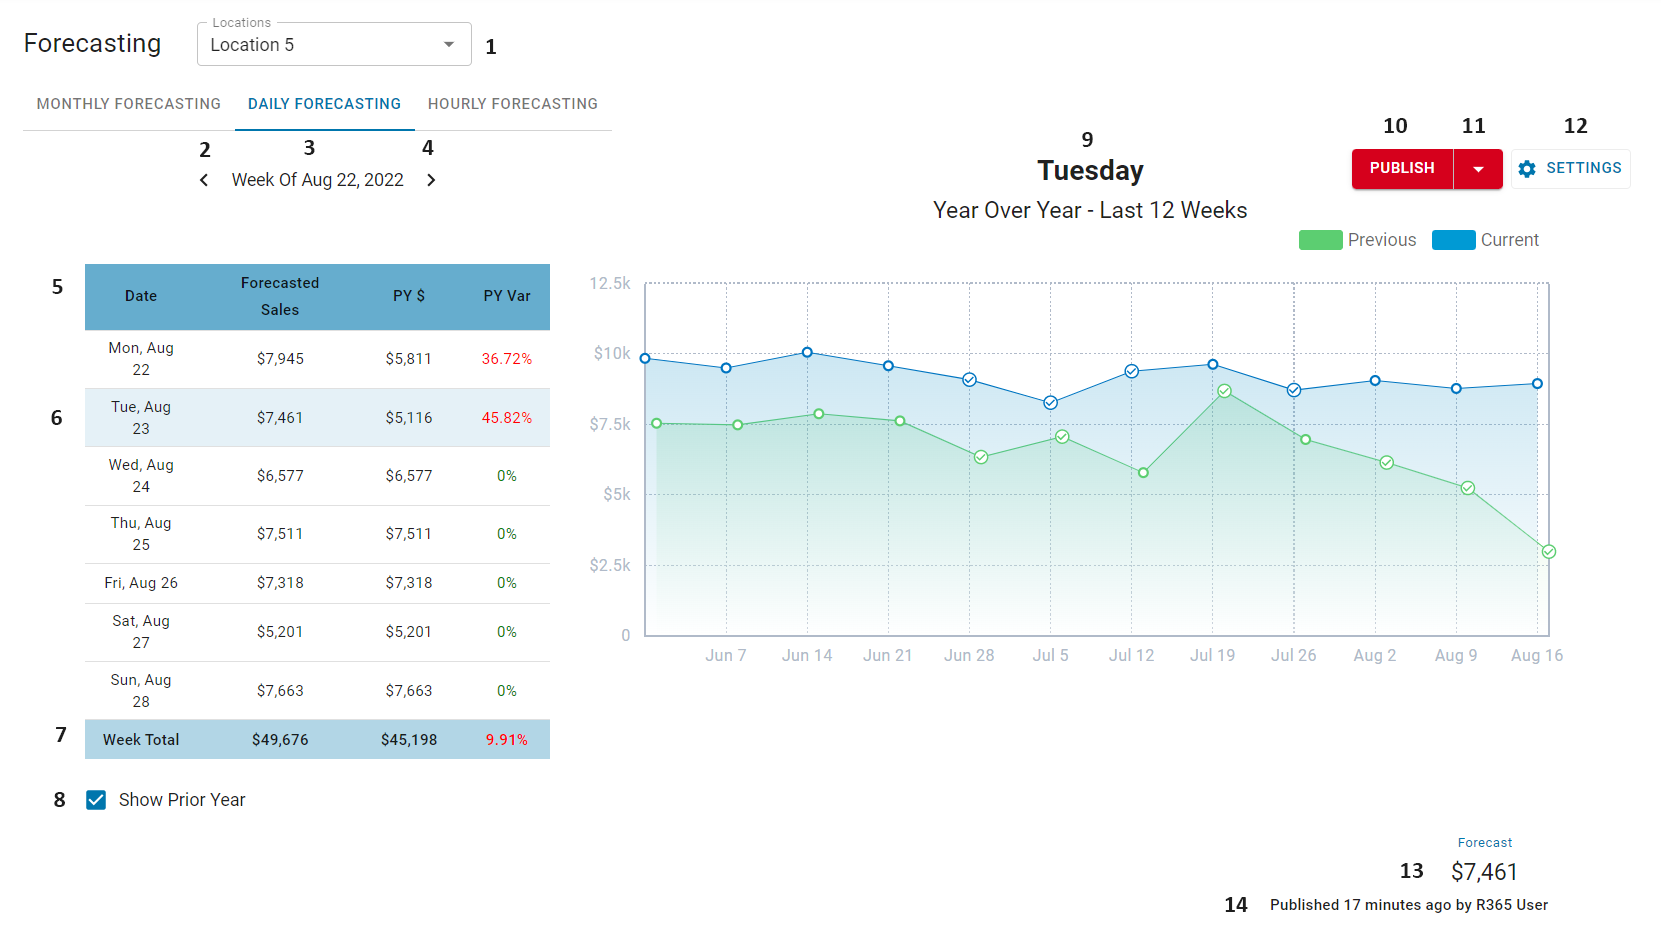
1) Location - The Location the Forecast is for. Only one Location can be analyzed at a time
2) Prior Week - This will shift the Date List (#5) to one week prior to the date listed
3) Week - The first day of the fiscal week listed in the Date List (#5)
4) Following Week - This will shift the Date List (#5) to the following week from the date listed
5) Date List - List of dates within the fiscal week, including the following columns:
Date
Forecasted Sales - Current published Forecasted Sales
PY $ - Prior Year Sales
PY Var - Difference between 'Forecasted Sales' and 'PY $', displayed as a percentage
If 'Forecasted Sales' is greater or the variance is within +/- 5% variance, the text will be displayed in green
If 'PY $' is greater or the variance is outside +/- 5% variance, the text will be displayed in red
6) Forecasted Date - The date that Sales are being forecasted for is highlighted in blue. Click a date from the Date List (#5) to change the date being forecasted.
If the Forecasted Date has passed, the Forecasted Sales amount will be locked and the 'Publish' button will be disabled
7) Week Total - 'Forecasted Sales', 'PY $', and 'PY Var' totals for all dates forecasted for the fiscal week
8) Show Prior Year - Click to show or hide the 'PY $' and 'PY Var' columns in the Date List (#5)
9) Daily Forecast Graph- The graph of Sales for the previous and current years, based on the Forecasted Date
Click a date from the Date List (#5) to change the date being forecasted.
The graph will not be displayed if the currently-published Forecast was published from the Monthly Forecasting tab. Click the 'Reset' button (#10) to reset the graph and make edits.
10) Action Buttons - The action button displayed is dependent on whether or not the Forecast for the day has been previously published or if the currently displayed Forecast has unpublished edits. The displayed action button can be changed via the 'Action' drop-down (#11) to one of the following options:
Reset -This will reset the Daily Forecasting page to the default settings, which includes resetting the selected days both on the graph and in the table, and updating the Forecast Value
This button can only be displayed when the Forecast is published or has been changed from the default settings.
Publish - The final Forecasted Sales amount will be published to the Smart Forecast for that specific day. When this button is clicked, a pop-up window will ask which other Locations will use the same algorithm. View the 'Publish Custom Forecast' section below for further information.
This button can only be displayed when the Forecast has been changed and contains unpublished edits.
Print - Runs the Forecast Report for the selected week
This button is only available for Users who have the Forecast Report assigned to their Report Roles
11) Action Drop-Down - Changes the displayed Action Button (#10)

12) Settings - When clicked, a menu will open where the comparison year used in Smart Forecasting can be updated. Options include:
Smart Forecasting (2022)
Smart Forecasting (2020)
Smart Forecasting (YOY)
These options will be disabled if historical data is not present for the selected date or Location
13) Forecasted Sales - This amount is the Forecasted Sales for the Location selected and is based on the prior 8 weeks' averages and the same 8 weeks from the previous year's averages; this applies a year-over-year trend.
If either the current or previous year is a day or more short of the other year, then all values for that year are averaged and used as the 'missing' days to ensure both the current year and the previous year have the same number of values to determine the markup or markdown.
14) Published Information - This indicates when the Forecast was published, who published it, and on which tab. Tabs include:
Monthly Forecasting
Daily Forecasting
Hourly Forecasting
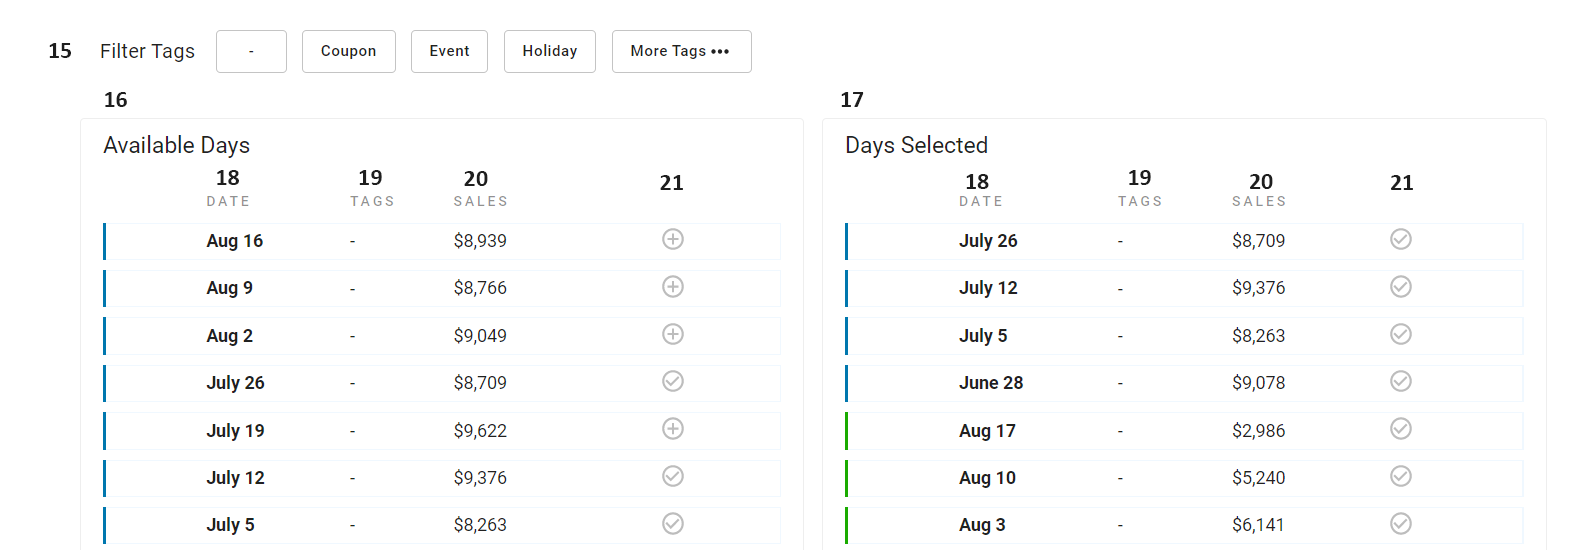
15) Filter Tags - Filters the Available Days list and Days Selected list for dates where tags have been added to the Daily Sales Summary to provide additional information about the fluctuation in Sales for that day.
Click 'More Tags' to filter for additional tags or to create, edit, and delete tags
16) Available Days List - This grid lists all available dates and their Sales (past 12 weeks) from the graph. Dates with a blue line next to them are from the current year, while dates with a green line are from the previous year (as reflected in the graph).
17) Days Selected List - This grid lists all dates and their Sales in the current selection (past 8 weeks) from the graph. Dates with a blue line next to them are from the current year, while dates with a green line are from the previous year (as reflected in the graph).
18) Date - The dates listed for the previous weeks and the same weeks from the previous year, based on the Forecasted Date
19) Tags - Any tags have been added to the Daily Sales Summary that provide additional information about the fluctuation in Sales for that day.
A User can also filter, create, edit, and delete tags through the 'Filter Tags' row above the 'Available Days' grid (#15)
20) Sales - The Sales Amount for that date
21) Daily Sales - The Sales points labeled on the graph. These points can be adjusted for a more accurate Forecast. Click here for more information on customizing a Forecast. There are two symbols displayed in this column:
 - The date and its Sales are included on the graph and play a factor in the Forecasted Sales
  - The date and its Sales are included on the graph, but its Sales are not factored into the Forecasted Sales
Create a Custom Forecast
The Daily Forecast will open to the following week's Forecasted Sales data. Use the Prior Day / Week or the Following Day / Week's arrows to the desired Forecasted Date. If this date is further than a couple weeks, click the date and a Calendar will pop-up where you can navigate easily to the desired Forecasted Date. Click 'OK' to update the date.
Once the date is updated, change the Location if needed, and the graph below will update.
Modify the Forecast
The forecast can be modified by manually updating the forecast in one of two ways:
(De)Selecting Points on the Graph - Click any data point to include or exclude it from the forecast calculation. Points with a checkmark in it will be included in the calculation
(De)Selecting Days from the Grids - Include days in the forecast calculation by navigating to the Available Days grid and clicking the '+' icon next to the corresponding dates. Exclude days from the forecast calculation by navigating to the Days Selected grid and clicking the checkmark icon next to the corresponding dates
Click here to learn more about customizing a Forecast.
The Forecasted Sales amount will be listed below the Daily Forecast Graph.
Publish a Custom Forecast
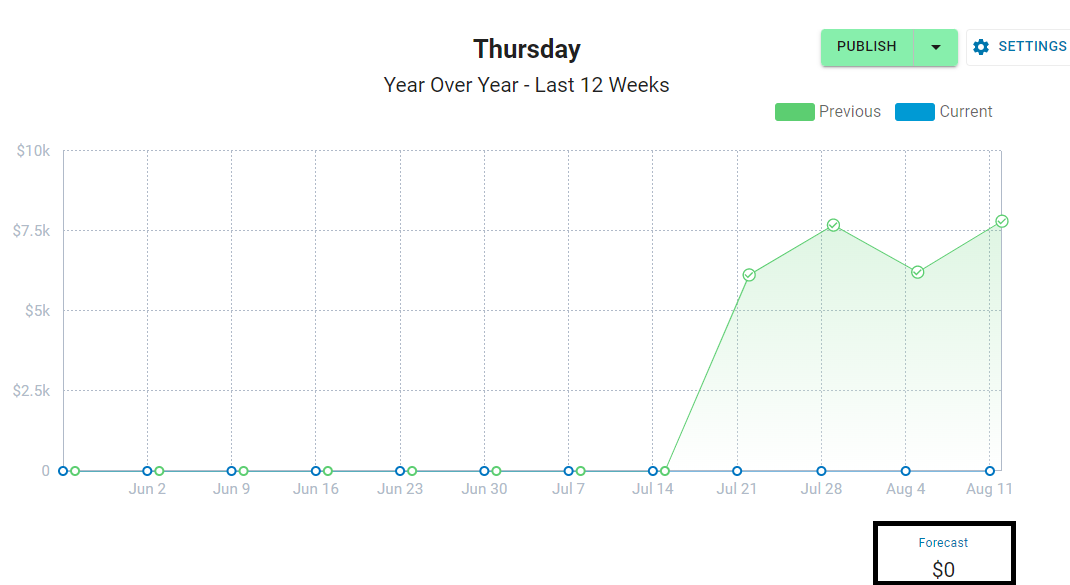
Once a Forecast is ready to be published in the Smart Forecast, click the 'Publish' button.
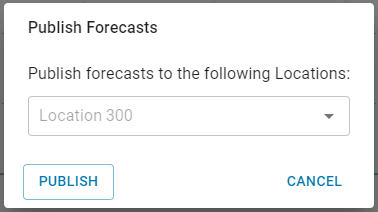
A pop-up window will appear that allows you to select the Locations that would benefit from the Forecasted Sales algorithm created from adjusting the Daily Sales amount. For events that occur across multiple Locations, such as a holiday or a coupon drop, the algorithm created for this Location could then apply to other Locations. In this case, select the Locations that would have a similar algorithm and then click 'Publish'.
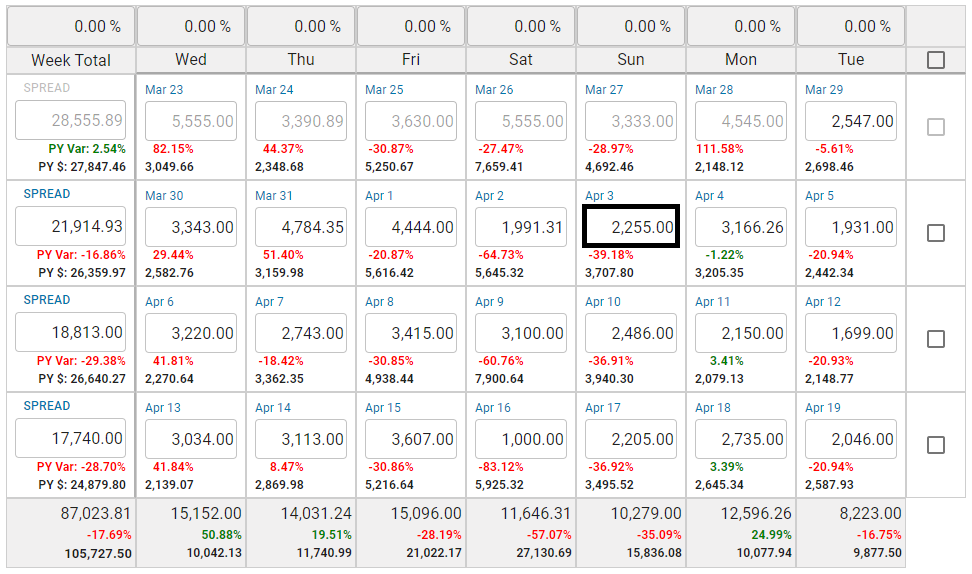
The Forecasted Sales amount will then be updated for that day on both the Monthly Forecasting and Hourly Forecasting pages.
Publishing Conflicts
If the Forecast for the day was published from the Hourly Forecasting tab, a warning will be displayed when publishing any changes:
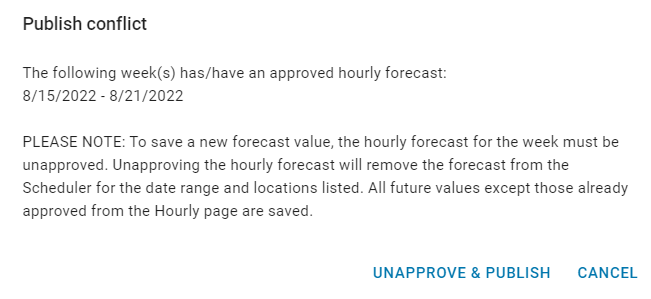
Clicking 'Unapprove & Publish' will unapprove the Hourly Forecast and republish the new Forecast for the day. Since the Hourly Forecast is unapproved, the Labor Forecast will not be displayed on the Scheduling Calendar. For the Labor Forecast to appear on the Scheduling Calendar, the Hourly Forecast will need to be deleted and re-generated.
Any day that has been changed and republished from the Daily Forecasting or Monthly Forecasting tabs will have a variance when viewed on the Hourly Forecasting tab.
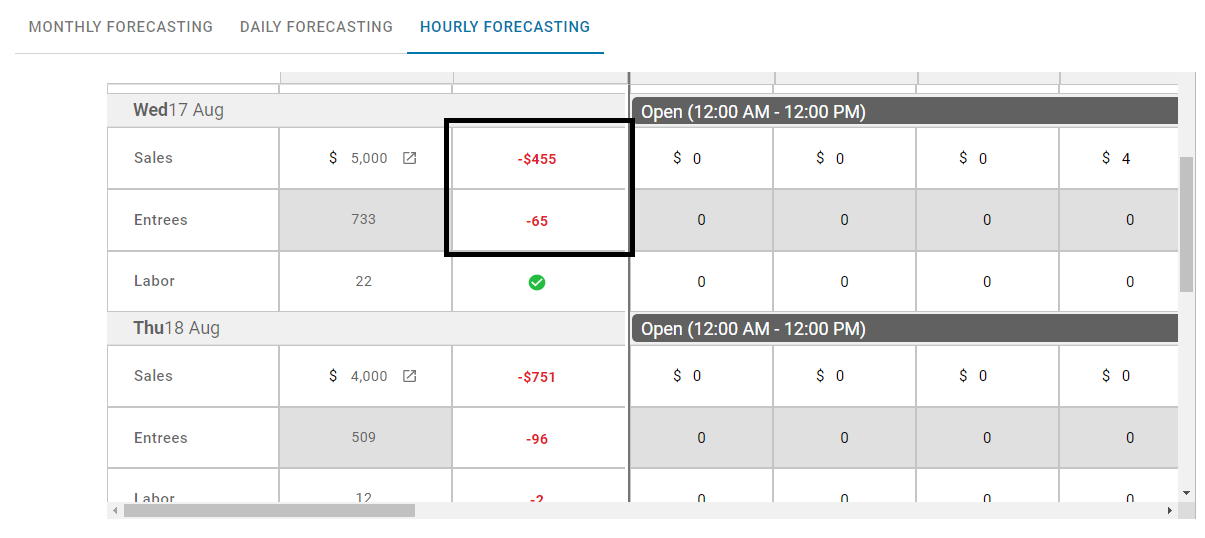
Follow these steps to clear and re-generate the Hourly Forecast:
Navigate to to the Hourly Forecasting tab
Delete the current Hourly Forecast

Click the 'Generate' button to re-generate the Hourly Forecast with the new Daily Forecasted value

Approve
