The Profitability report is based on the Profit and Loss report and combines monthly Costs and Sales to calculate a single chosen Location's estimated Profit. This report combines actual data for the month up to the current day and the forecasted amount, which is based on the actual Sales over the last 8 weeks, for the remaining days to construct this Location's bottom line.
Comparing the Average Weekly Sales, Spend Per Guest, and Weekly Guest Count against calculated Profitability Targets help to guide decision-making processes around restaurant operations and to show if a Restaurant Location is on the path to profitability.
If expenses are more than Sales, optimize Labor and COGS to ensure your Organization becomes profitable. View the following resources to determine the best way to analyze and alter your current spending:
Navigation
To navigate to the Profitability Report, click 'My Reports' under 'Reports' in the left pane and then select 'Financial' in the top header of the reporting window. Once opened, a listing of reports will be shown.
Find 'Profitability Report' and select 'Customize' next to the report. This will open up a listing of all Report Parameters that can be used to define your report.
Report Parameters

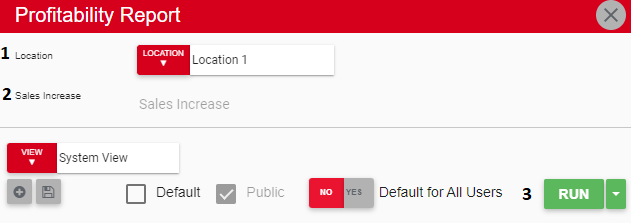
Location - A listing of all Locations
Sales Increase - An estimated Sales increase percentage. The amount entered here will show the impact of this Sales increase in the report
Run Button - Runs the report. Users can also send, export, or print the report directly from this button by clicking the down arrow portion and selecting the desired action. Click here to learn more about this functionality
Click here to learn more about Report Views and their added functionality.
Report Columns

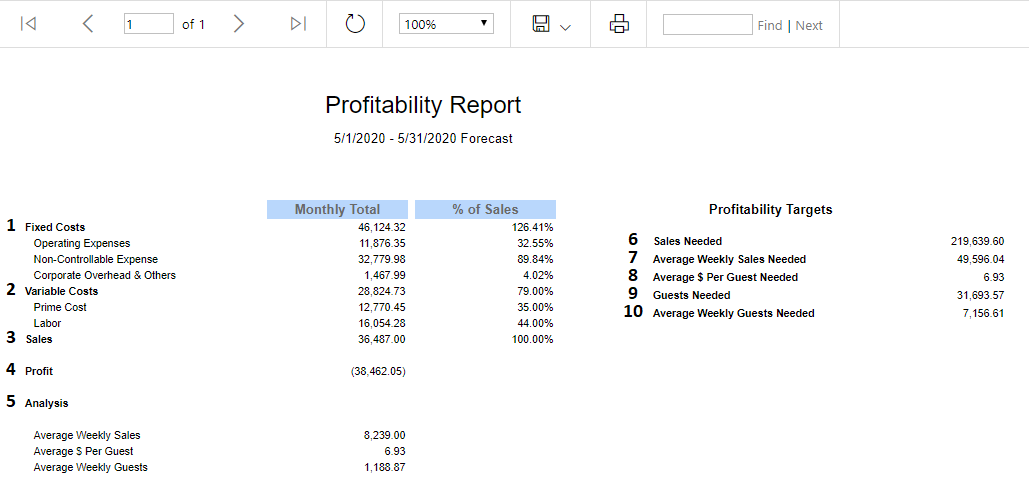
Fixed Costs - The actual Fixed Costs as of the date this report is ran + the 8 week average forecaster value times the same value for the day from last year for the remaining days in the month, which is based on the actuals over the last 8 weeks. Click here to learn more about the Forecasting
Variable Costs - The actual Variable Costs as of the date this report is ran + the 8 week average forecaster value times the same value for the day from last year for the remaining days in the month, which is based on the actuals over the last 8 weeks. Click here to learn more about the Forecasting
Sales - The actual Sales as of the date this report is ran + the 8 week average forecaster value times the same value for the day from last year for the remaining days in the month, which is based on the actuals over the last 8 weeks. Click here to learn more about the Forecasting
Profit - The estimated Profit (Fixed Costs + Variable Costs - Sales)
Analysis - The current averages for Weekly Sales, Spend per Guest, and Weekly Guests based on the sum of actual and forecasted amounts
Sales Needed - This is the total Sales needed to cover all expenses and profitability targets
Average Weekly Sales Needed - This is the Total Sales needed to cover all expenses each week in the month and profitability targets
Average $ Per Guest Needed - This is the average spend per guest needed to cover all expenses and profitability targets
Guests Needed - This is the number of guests needed to meet the Sales Needed amount (#6), given an average spend per guest
Average Weekly Guests Needed - This is the number of guests needed to meet the Average Weekly Sales Needed (#7), given an average spend per guest
Email, Export, or Print the Report

This report can be emailed, exported, or printed in custom formatting directly from the reporting window. Click here to learn how to send, export, or print this report.