The P&L Comparison compares locations by amount or percentage.
This is accomplished without granting those Users access to the other Locations and Data. The data that is returned is anonymized by replacing the Location Name / Number with a generic 'Location #' value. This allows for a true comparison, without additional security access, and full disclosure.
To learn more about the added benefit of this screen, view Tip #6 of R365's 'Back to School' Tips & Tricks.
As a reminder, each User will see All Locations regardless of if they have been assigned those Locations. Unassigned Locations will appear as 'Location 1', 'Location 2' etc. Therefore, if you only have two Locations, it will not be hard for your users to determine that the 'Location 1' data is from the other Location in your Restaurant Group. Please use with caution if you only have two Locations.
Navigation
Open the Reporting application.
Click P&L Comparison.

Security
The following permission is required to view the P&L Comparison page.
Reporting → Standard Reporting → Can View P&L Comparisons Page
P&L Comparison Parameters

Button/Field | Description | |
|---|---|---|
1 | Report Type | The P&L report type. Options include:
|
2 | Detail Level | The amount of detail that will be included in the report. Options include:
|
3 | Calendar | Sets the report to run on the fiscal or operational calendar. |
4 | As of | Sets the as of date for the report, options include:
|
5 | Show Unapproved | Determines if unapproved transactions will be included in the report:
|
6 | Rounding | Sets the rounding for the report:
|
7 | Compare by | Determines how the report will be compared. Options include:
|
8 | View Report | Generates the report. |
Anonymized Locations
For each Location a User has access to (via their assigned Locations on their User Record) they will see the Location name displayed as shown below:
Users that have access to limited locations will see the other Locations listed as 'Location 1', 'Location 2' etc.

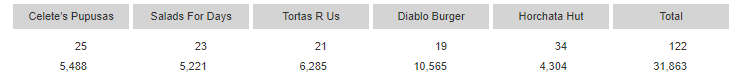
Location Ranking / Column Sorting
A very neat feature on the P&L Comparison Screen is the ability to rank, or sort, each Location based on the value of the selected Account.
Find the GL account that to be ranked.
Click once on the GL Account name to sort from 'Least to Greatest'.
Click a second time on the GL Account name to sort from 'Greatest to Least'.
Notice how the Columns (or Locations) are resorted with each click. This gives a quick ranking of how your Location is doing compared to other Locations in that particular Sales / Expense area.